
CONTENTS

USA
Thank you for reaching out to Sigma Software!
Please fill the form below. Our team will contact you shortly.
Sigma Software has offices in multiple locations in Europe, Northern America, Asia, and Latin America.
USA

Sweden

Germany

Canada

Israel

Singapore

UAE

Australia

Austria

Ukraine

Poland

Argentina

Brazil

Bulgaria

Colombia

Czech Republic

Hungary

Mexico

Portugal

Romania

Uzbekistan
16 min read
Every business has a treasure trove of data. Stacked across multiple business systems are the answers to better sales volumes, higher cost-efficiency, and better business resilience.
Despite advancements in data analytics, machine learning, and generative AI, less than half (48%) of businesses have “created a data-driven organization” according to a Wavestone 2024 survey. Snowflake data tells a similar story: 51% of managers rely on a mix of data and experience or gut feeling in decision-making and only 18% predominantly make data-backed decisions.
Data isn’t scarce. Neither are the means to analyze it. Business intelligence software is a $29.42 billion market, growing yearly, and numerous large language models (LLMs) can do the numbers’ fidgeting.

The problem is more prosaic: Businesses need more processes and culture to make data useful. For 59% of businesses, “making data sources known and connectable for data & analytics purposes” is the biggest barrier to becoming an insights-driven organization.
Leaders have little idea of their data quality, its location, or possible utility. In other words, they operate with substantial data debt.
Data debt is the hidden costs and inefficiencies from free rider decisions in data infrastructure and management practices.
Similarly to technical debt, data debt is acquired when choosing a quick-fix solution for short-term gains over a more complex, future-proof approach.
Here’s an example: you have an analytics app for report generation, but the format keeps changing every day without any reason. Since these changes are not documented, the analysts have to figure out how to interpret the new format. That’s a ton of wasted effort (and money).
Such scenarios happen every day, in every organization. Digitized business processes duplicate data across multiple stores, creating data silos and high storage costs. Report generation requires unreproducible work from data scientists. Senior engineers spend months building a complex analytical algorithm for a use case that could be solved with a simpler and more cost-efficient method.
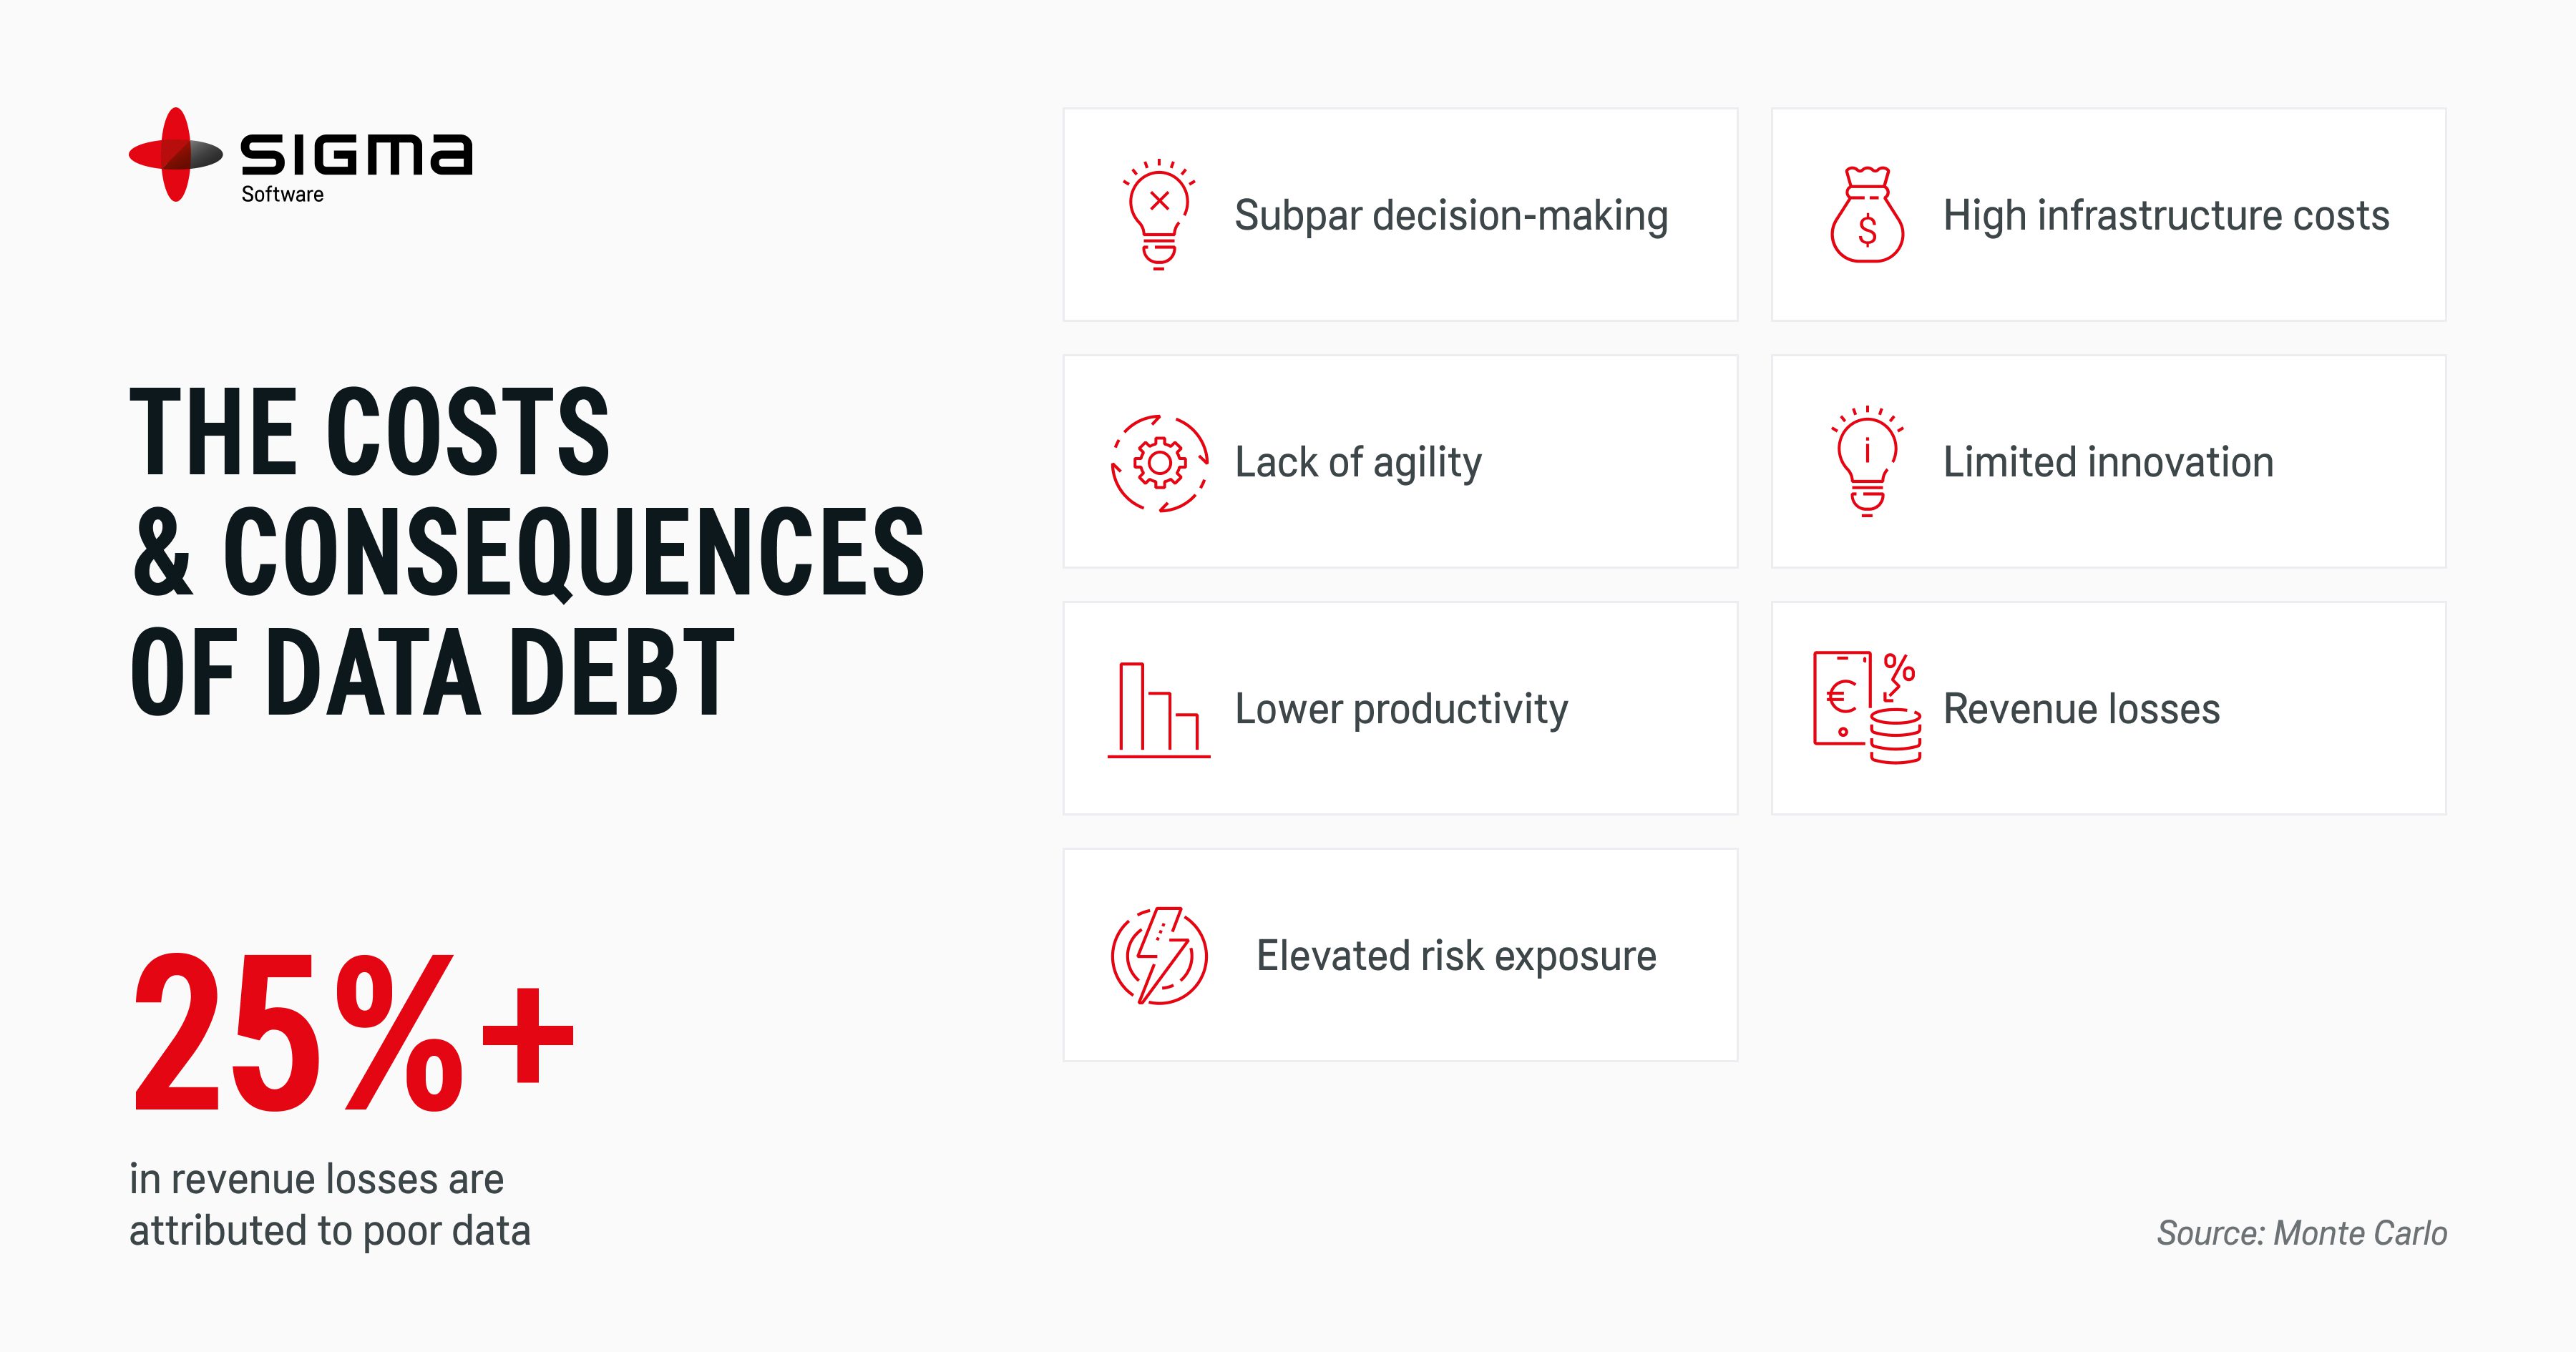
All of the above are symptoms of data debt — and both your employees and customers pay the price. Almost three-quarters of employees say their productivity relies on good data and access to it, but 32% lack this.
Refevi research also found that 40% of leaders believe bad data reduces customer trust (and investor trust in the case of e-scooter company Bird, which over-reported their revenues for two years due to a data quality issue). Monte Carlo research suggests over half of businesses lose 25% or more of revenue to data quality issues.
Like financial debt, data debt is inevitable in ambitious projects. But it needs to be repaid, or you risk becoming its hostage.
John Ladley, who originally coined the term data debt, also articulated the four ways how companies acquire it:
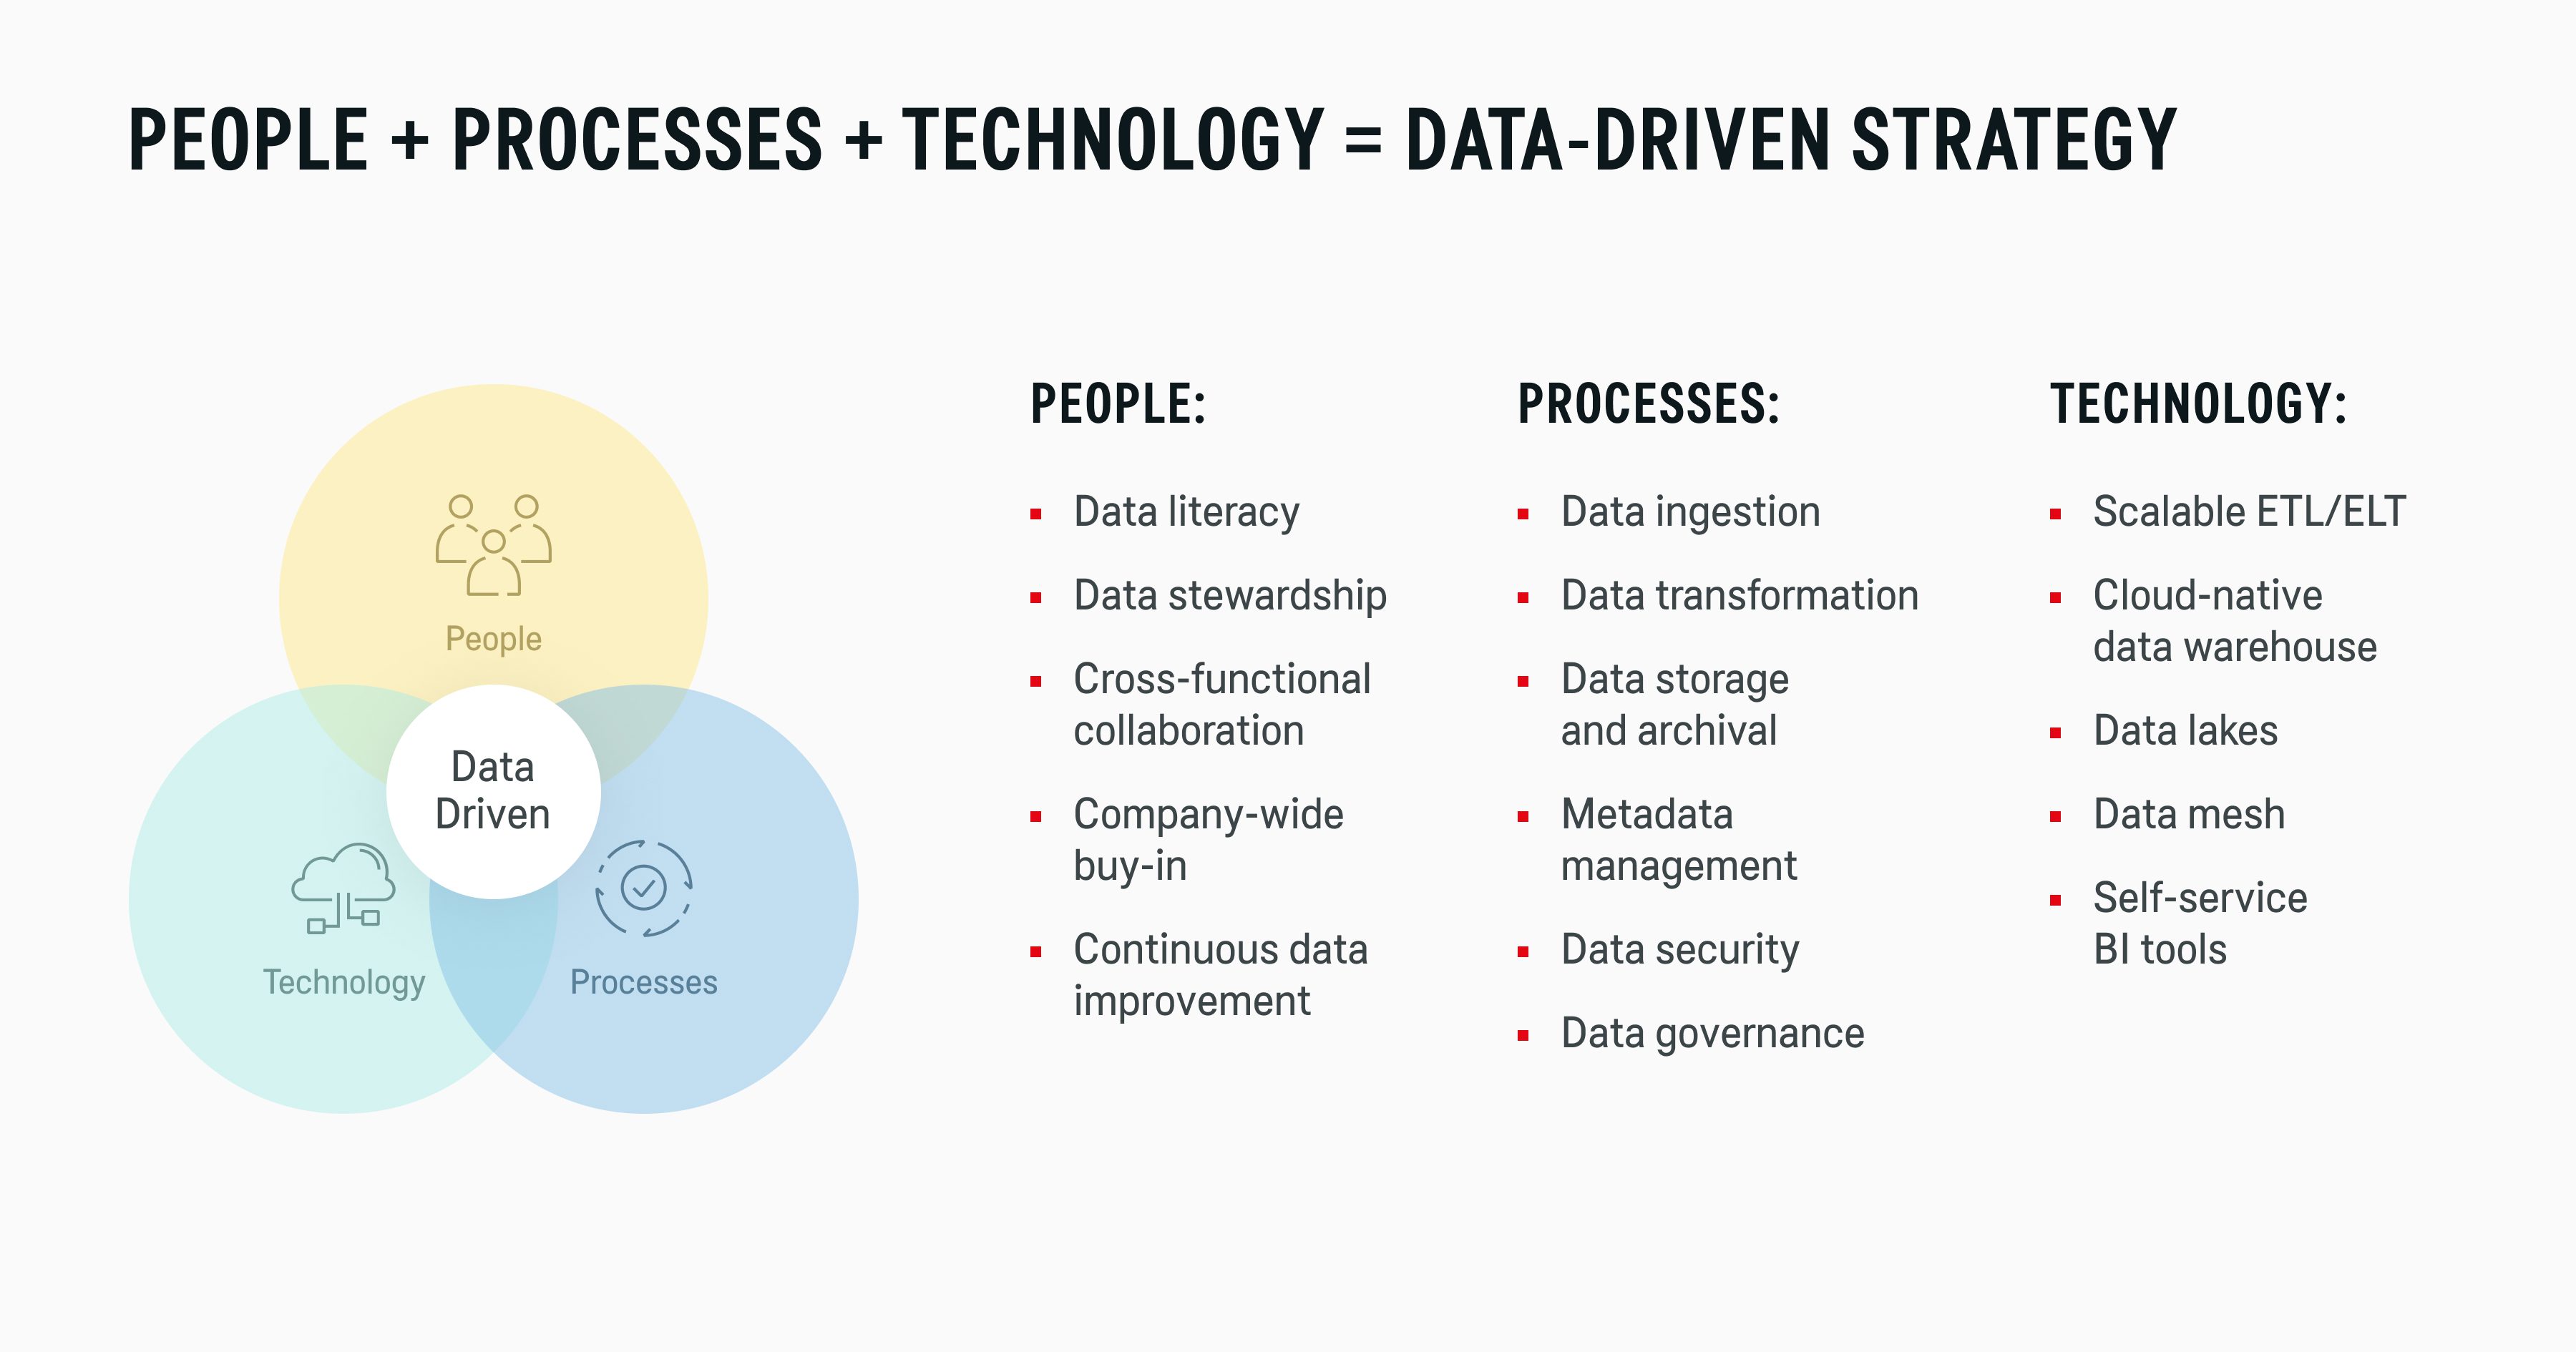
These debts have a common underlying reason: inefficiencies in the people-processes-technology triangle of effective data management.
At the highest level, your organization has two types of processes: data production and data consumption.
Data producers are the root source of data — a person, a digital application, or a connected device that creates terabytes of raw data. Applications like ERPs, IoT platforms, and POS solutions are data producers, as is your workforce, manually typing in new reports or building spreadsheets.
Data consumers include people and systems that transform raw data into valuable insights using available analytical tools and techniques like ad-hoc querying, pre-made dashboards, or BI tools.
However, many organizations have a dysfunctional relationship between data producers and data consumers, as they produce a lot but consume too little.
Only 32% of enterprise data is analyzed and used for decision-making, while the remaining 68% is unleveraged.
Those volumes of unleveraged data typically fall into one of the next categories:
These data classes exist when companies lack a unified data management approach. Data collection and inputs are mostly manual. Some data is ingested and stored in a data lake but without oversight. Data pipelines aren’t easily replicated across systems, causing inefficiencies for data consumers.
One of Sigma Software’s clients, an enterprise in professional services, experienced the above issues. The financial team needed a week to produce a financial report because of data silos and manual data collection methods.
Our data analytics team proposed and implemented a new architecture to streamline data collection, transformation, and report generation. We used Apache Spark for high-performance ETL pipelines to a new data warehouse (DWH) built with MS SQL Server and Tableau. The ingestion pipeline integrates multiple data sources and databases, ensuring system scalability and versatility. Tableau allows seamless report generation and data visualization in different formats, with outputs saved to SharePoint. All charts and reports are easily accessible and shareable.
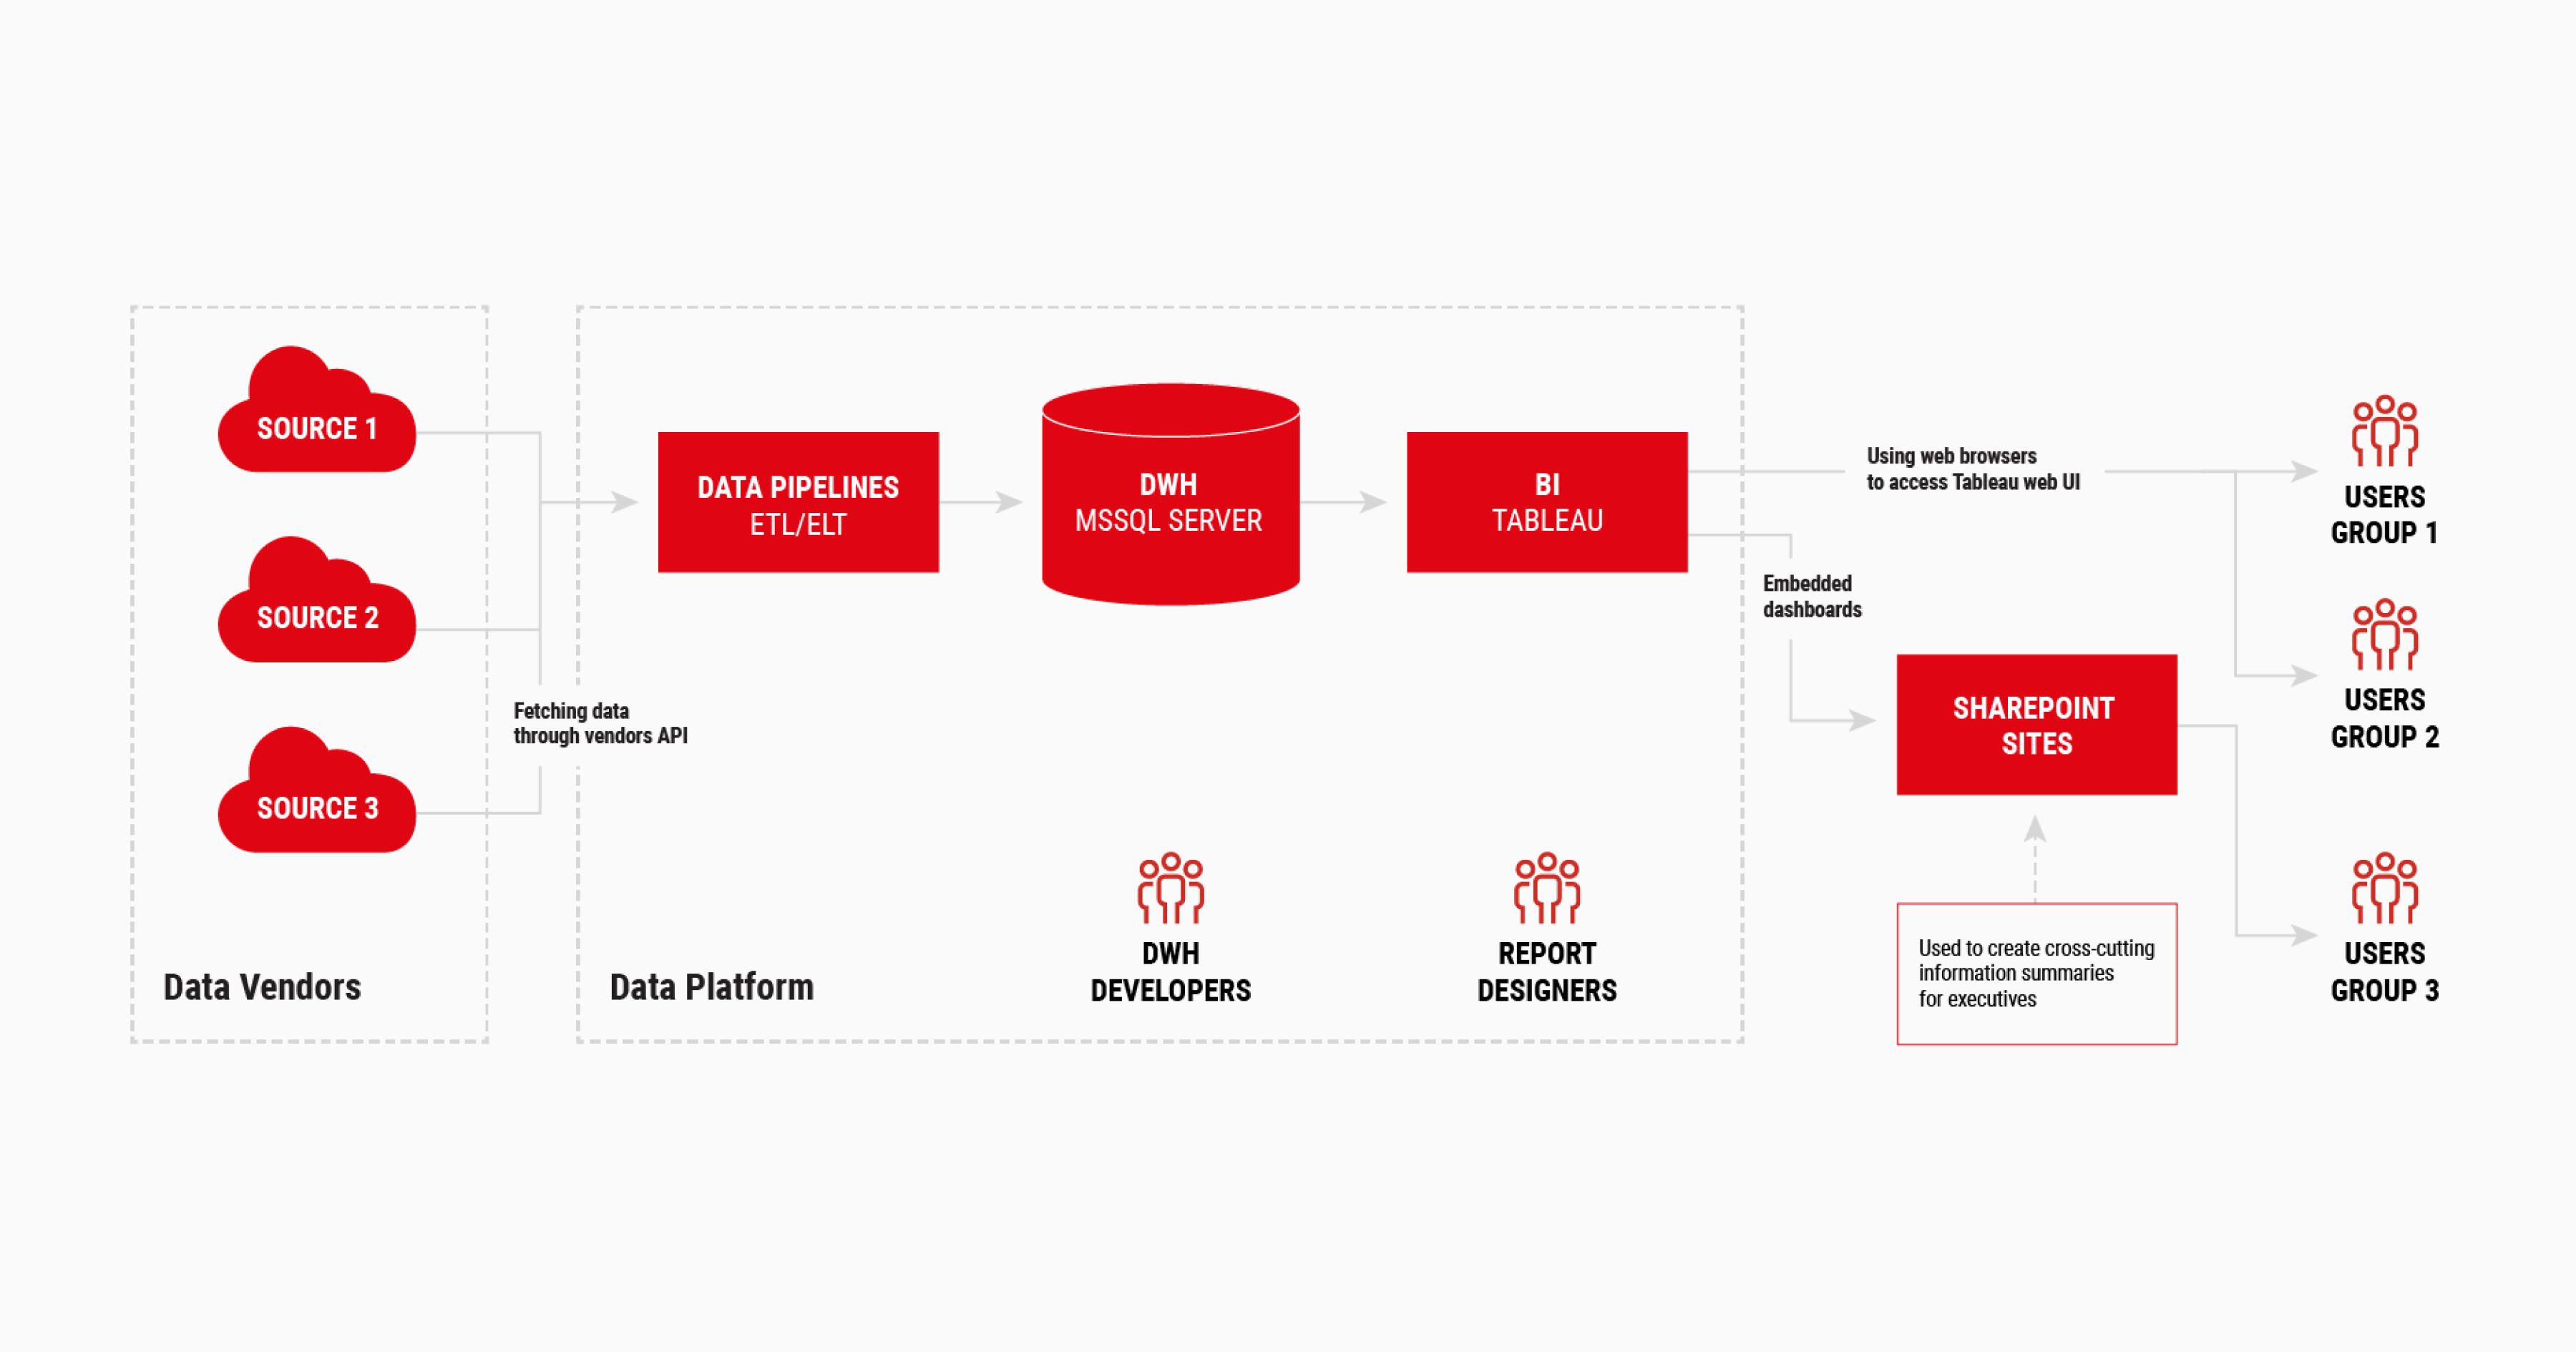
The new setup reduced report generation times from one week to one minute. Accuracy also increased, thanks to automatic data validation and quality checks. New data gets added hourly, daily, weekly, or monthly, allowing business users to access the latest reports via the corporate SharePoint portal, integrated with the analytics system.
Few businesses start building data infrastructure from a clean state. Instead, they build on existing solutions. Legacy technology has inherent constraints: Outdated warehousing solutions with legacy data formats, obsolete ETL pipelines, and hard-coded data logic in applications.
Generally, 78% of companies find it challenging to migrate from legacy technology, especially with legacy databases, DHWs, and other data storage platforms. Data migration carries risks: data loss or corruption, downtime, and regulatory non-compliance.
The good news is that these risks can be mitigated with the right data migration strategy.
Siemens Healthineers wanted to migrate its CT monitoring system to Azure Cloud for extra scalability. The system aggregates data from thousands of Siemens CTs worldwide, but due to legacy tech, its performance lagged.
Sigma Software team joined the project together with the Client, Microsoft experts, and several other vendors. In collaboration, we designed a new cloud-based data analytics architecture utilizing Azure infrastructure and an open Data Lakehouse platform by Databricks to boost processing speeds and minimize data processing costs across all formats. The team securely migrated all analytics business logic and set up cloud-native ETL pipelines to stream data to Qlik and Power BI applications.
Data debt can also spike when your workforce rapidly expands, or you acquire new products. Effective data management for a team of 10, 100, or 100,000 users will vary a lot. Many organizations prioritize product features over repaying data debt, leading to an ineffective data stack.
Likewise, business requirements change over time, demanding faster processing of larger data volumes. This was the case of AOL, which acquired an advertising management platform and wanted to scale it into an enterprise-grade solution. The Sigma Software team helped scale the AdTech platform to process over 2.5 million events per second and generate reports across 400 metrics in 1.5 minutes.
The new AWS-based platform architecture reduced data latency from 2h to 5 minutes, enabling real-time campaign optimization. The new data governance process and smart infrastructure monitoring ensure high platform availability 24/7.
With the right processes and infrastructure in place, there’s still one more component left to address – your people. Low trust in data quality, lack of collaboration, and unease with analytics tools are also driving factors behind data debt.
According to a Deloitte survey, 67% of senior managers “are not comfortable” using data from advanced analytic systems. At companies with a mature data-driven culture, the number drops to 37%.
A data-driven culture assumes high data literacy and the habit of using insights for decisions. Without deliberate investments in data culture, technology solutions will fail to bring maximum dividends.
“When an organization’s data mission is detached from business strategy and core operations, it should come as no surprise that the results of analytics initiatives may fail to meet expectations. But when excitement about data analytics infuses the entire organization, it becomes a source of energy and momentum. The technology, after all, is amazing. Imagine how far it can go with a culture to match.”
Educate your business users on the new data analytics tools and expose teams to a limited number of relevant metrics on the analytics dashboard to reduce the learning curve. This also gives engineering teams more time to improve data management processes in the background.
To increase adoption and deal with resistance, ask your workforce to collaborate on data initiatives. Engage data scientists and business analysts in cross-functional teams. For example, a global insurance company rotates data scientists out of centers of excellence and into line roles, where they scale up analytics proof of concept alongside department teams.
By bringing engineering teams closer to the business, you also make them more connected to the business needs. Spotify, for example, made deliberate efforts to shift the role of mobile DevOps teams in understanding and interacting with data.
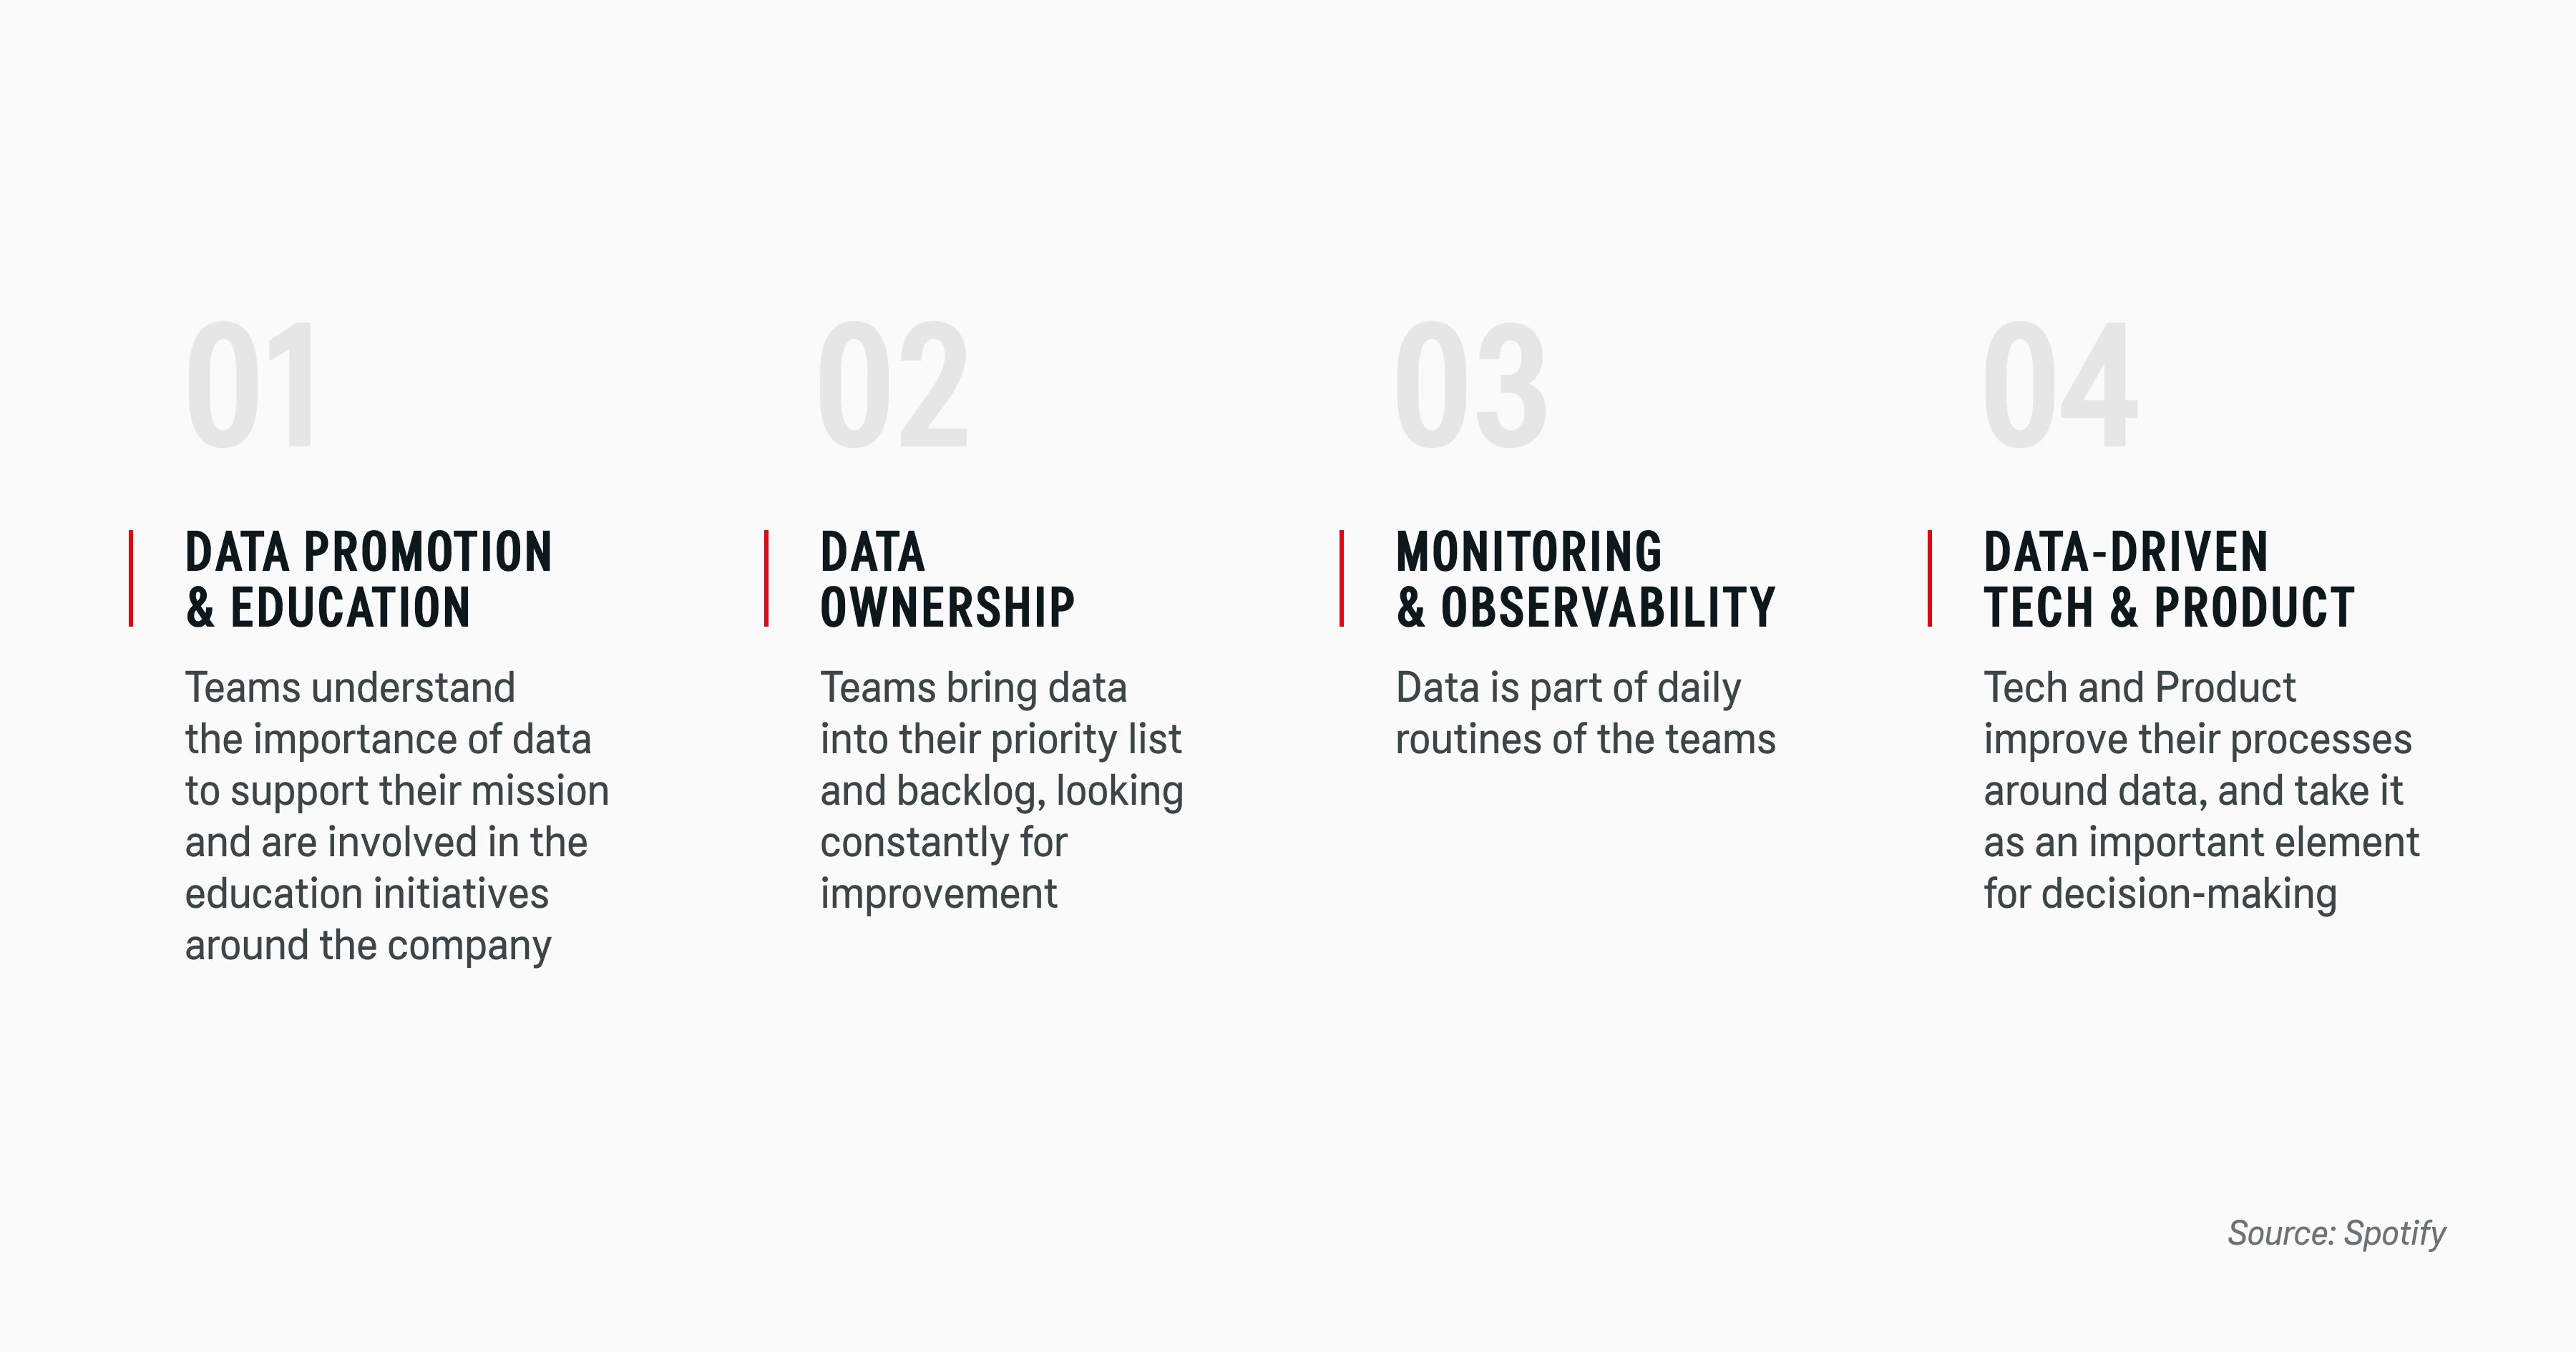
Source: Spotify
The goal of this shift: teach technical teams on how to use data to solve product-related problems instead of just infrastructure-related ones. This shift led to improvements in internal development processes with more grounded decisions for selecting optimal product languages for new product components, as well as a slew of innovative data-driven product features like an AI DJ for personalized music selection.
To eliminate the most pressing data debt and curb its proliferation in the future, businesses need to get six elements right:
Understanding how your organization handles data is the first step to effective data management. Start by conducting an inventory to document all data sources, including:
Data discovery tools and IT asset management services automate the process and collect asset metadata to establish its location, ownership, and security statuses. The next step is categorizing all data using a system that suits your organization. At Sigma Software, we classify data assets by type, value, and criticality levels, and map relationships between different data assets.
Data asset classification may be tedious, but it simplifies understanding, searching, and governing your estate. It also helps map sensitive data and ensure top protection. Microsoft Purview, for example, automatically discovers and classifies data across Microsoft environments, Azure deployments, Amazon S3 buckets, Amazon RDS databases, and on-premises assets, and checks their statuses against defined security, access, and identity management (IAM) policies.
Implement metadata management — an automated process for collecting and documenting assets’ properties such as schema, ownership, lineage, quality status, retention policies, and classification labels.
Your goal is to have full visibility into your data estate to set the baseline and prioritize key areas of improvement.
Data architecture translates business needs into infrastructure and data requirements. It details how data is ingested, stored, and used by systems in your portfolio, plus documents principles and policies for data management.
Sample data architecture for an AdTech platform
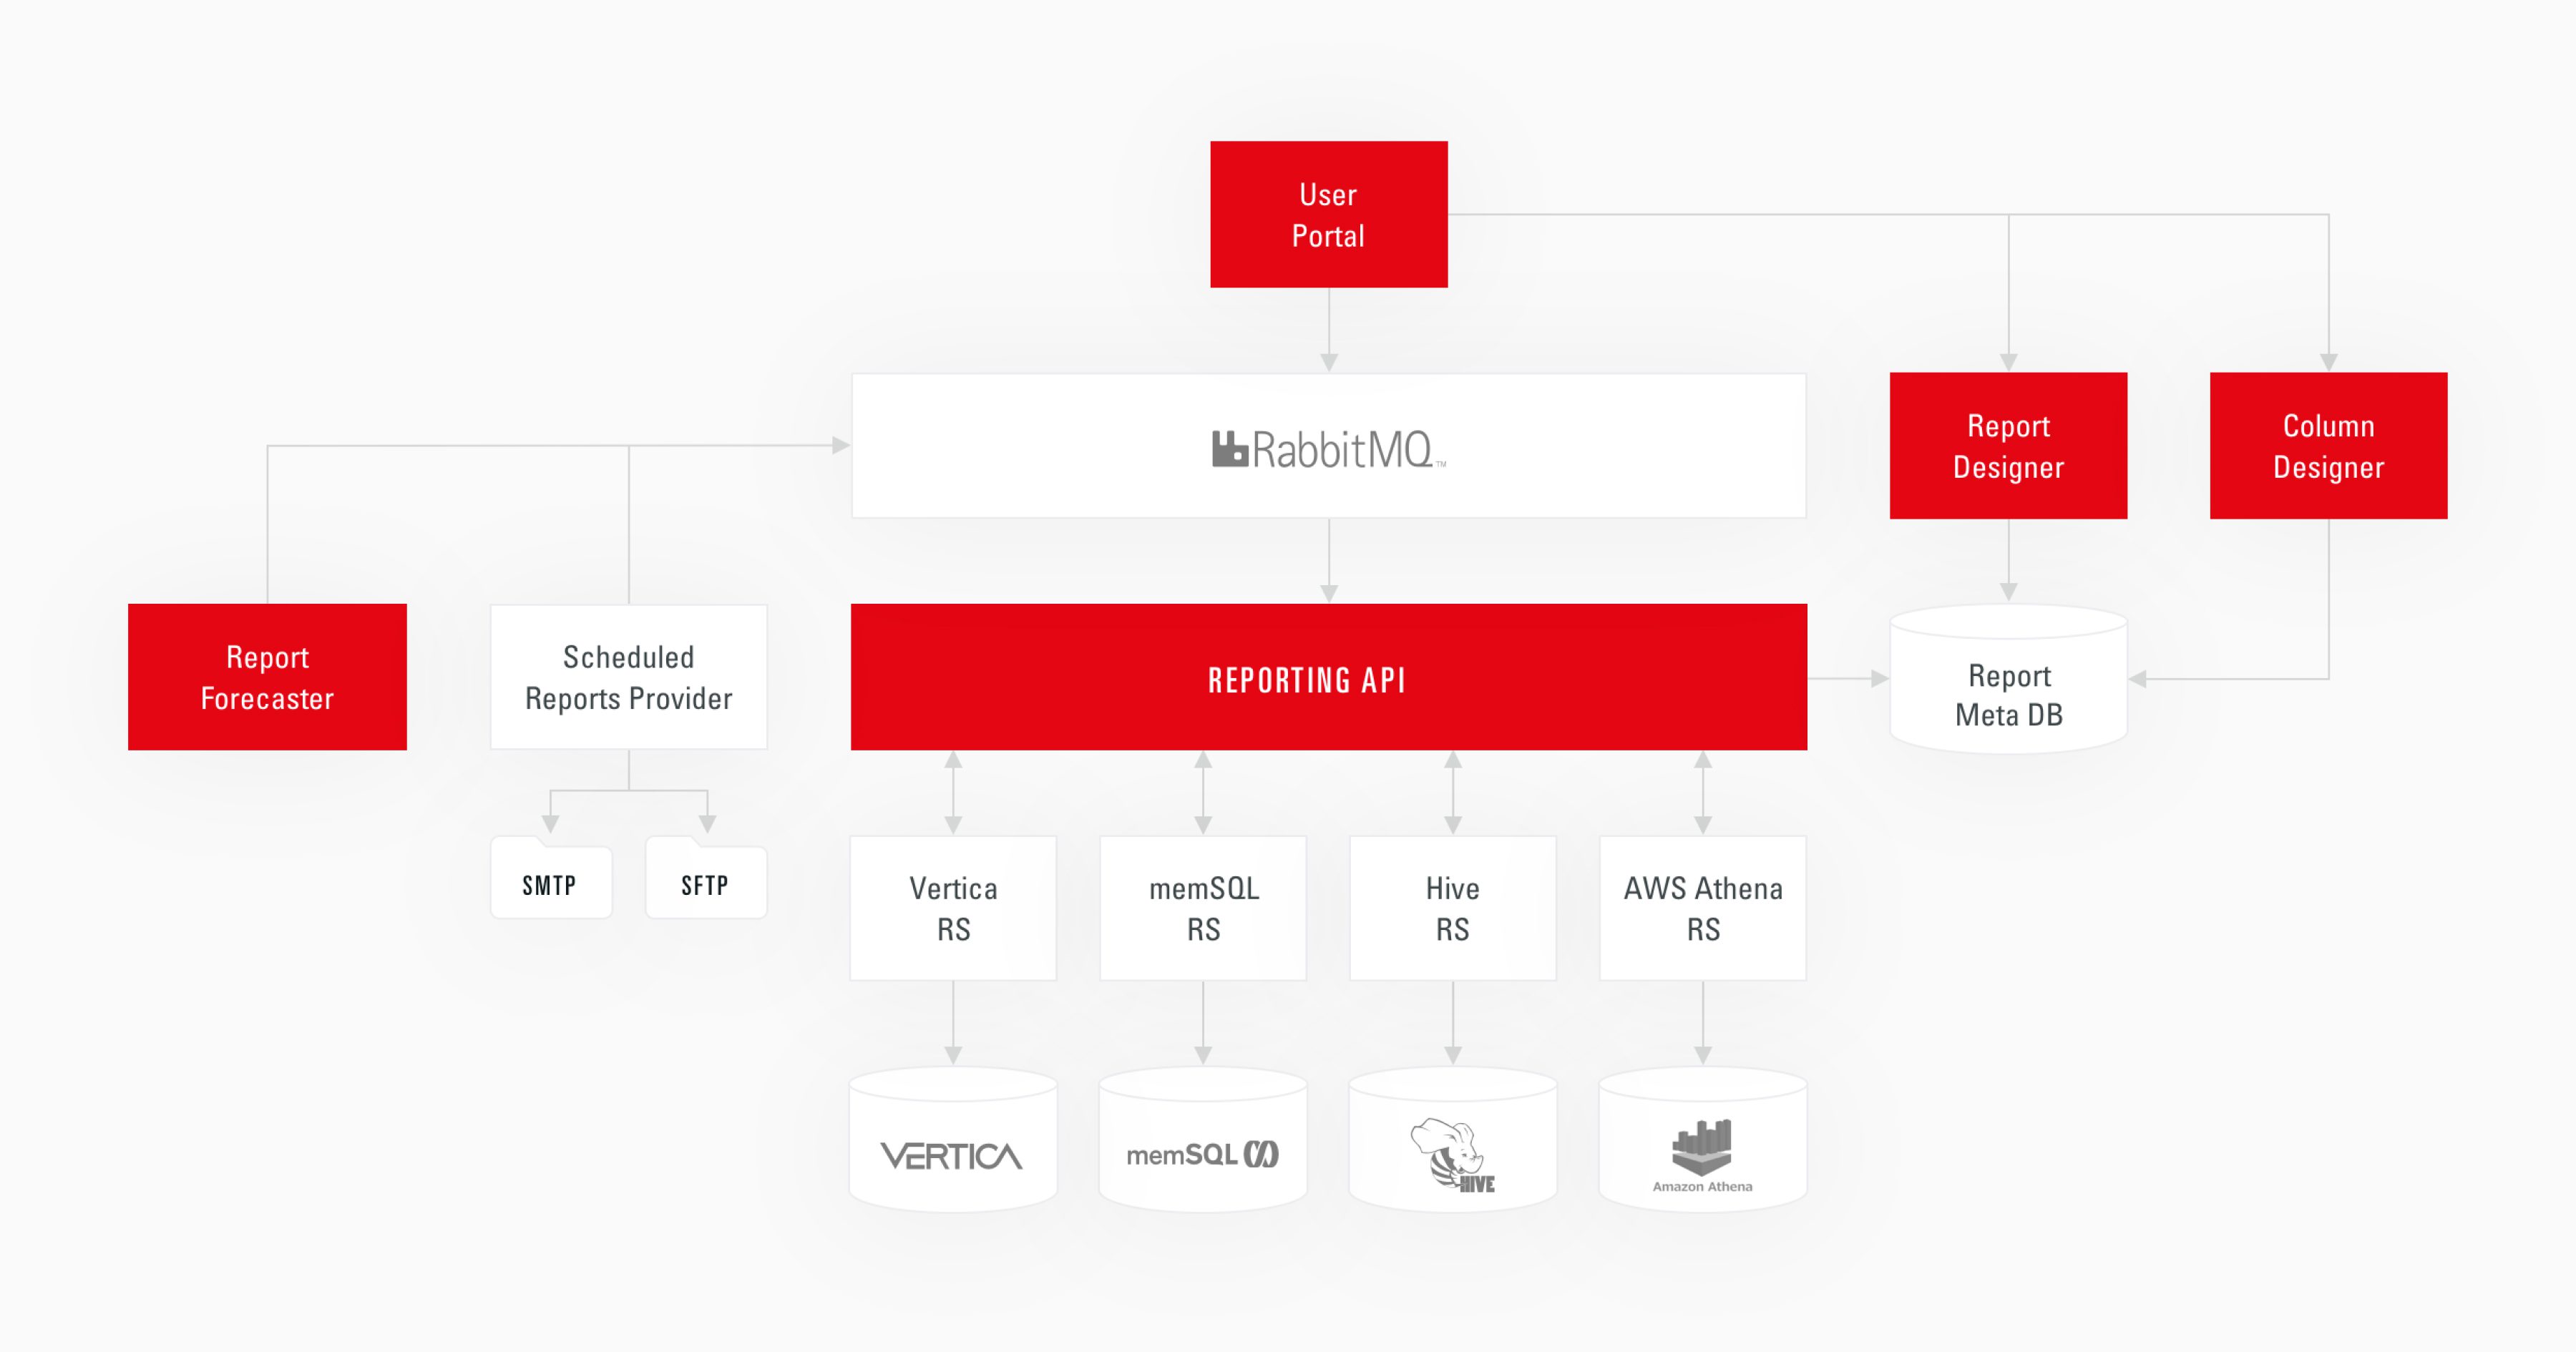
The main components of data architecture are:
Essentially, a data architecture documents data flows within an organization and ensures effective data transformation from raw to analytics-ready state.
The main cloud data storage options are data lakes, data warehouses, and data lakehouses.
Scalable data lakes can host semi-structured and unstructured data with minimal schema. They eliminate the need to store data in different formats in separate environments, enabling organizations to build larger datasets for ad hoc, explorative data modeling, like predictive sales forecasting or preventive equipment maintenance schedules.
On the downside, a data lake can easily become a data swamp due to uncontrolled data proliferation, limited cataloging, and lack of lifecycle management, leading to data debt. Larger data lakes also take more time to query with business intelligence tools, causing prolonged report generation. This can be addressed by building a higher concurrency query engine.
Data warehouses contain structured data from connected business systems. DHWs have pre-defined and fixed relational schema, requiring extra data transformation prior to storage (normalization, formatting, validation, etc). This makes data warehousing more expensive than ingesting data to a lake but improves data quality, consistency, and accessibility as modern self-service BI tools can query data from the connected DHW.
A third option that has emerged on the market is data lakehouses — an open data architecture where data and computing resources are separated into different clusters, enabling greater scalability and cost efficiency.
In a data lakehouse, all data is stored in open-source file formats like Parquet or Optimized Row Columnar (ORC), suitable for all data types (structured, unstructured, and semi-structured) at an affordable cost.
The metadata layer provides a unified catalog for all stored assets, helping users organize, label, and govern the data. It implements indexing for faster querying, workload isolation for greater concurrency, and ACID transactions for data consistency. The layer supports programming languages like Python, R, and high-performance SQL, making it easier to connect various business analytics tools and custom models.
Each data storage option has its merits and a slew of challenges in implementation and ongoing management. Sigma Software can suggest the optimal approach based on your requirements.
A data pipeline is an automatic sequence of steps for data ingestion, processing, and storage in a target location. In other words: they transport raw data from the source to the store.
The Extract Transform Load (ETL) model is the most common data pipeline paradigm: raw data is retrieved, transformed, and loaded to a data store. The steps can include:
The Extract Load Transform (ELT) reverses the steps with the transformation applied within the target storage. This is common when transferring large data volumes to a data lake and applying transformation later as part of query processing. ETL/ELT pipelines process data in bulk at scheduled intervals, causing some latency.
Streaming pipelines are gaining popularity for real-time analytics use cases (e.g., fraud detection or ad bidding). Solutions like Apache Kafka Streaming, Apache Flume, and Apache Storm process data as it moves through the pipeline (apply filters, aggregation, and enrichment) before reaching the target system. These transformations are event-driven, and immediately triggered as new data is available in the source system. This way of data processing reduces latency, enabling ultra-fast analytics access.
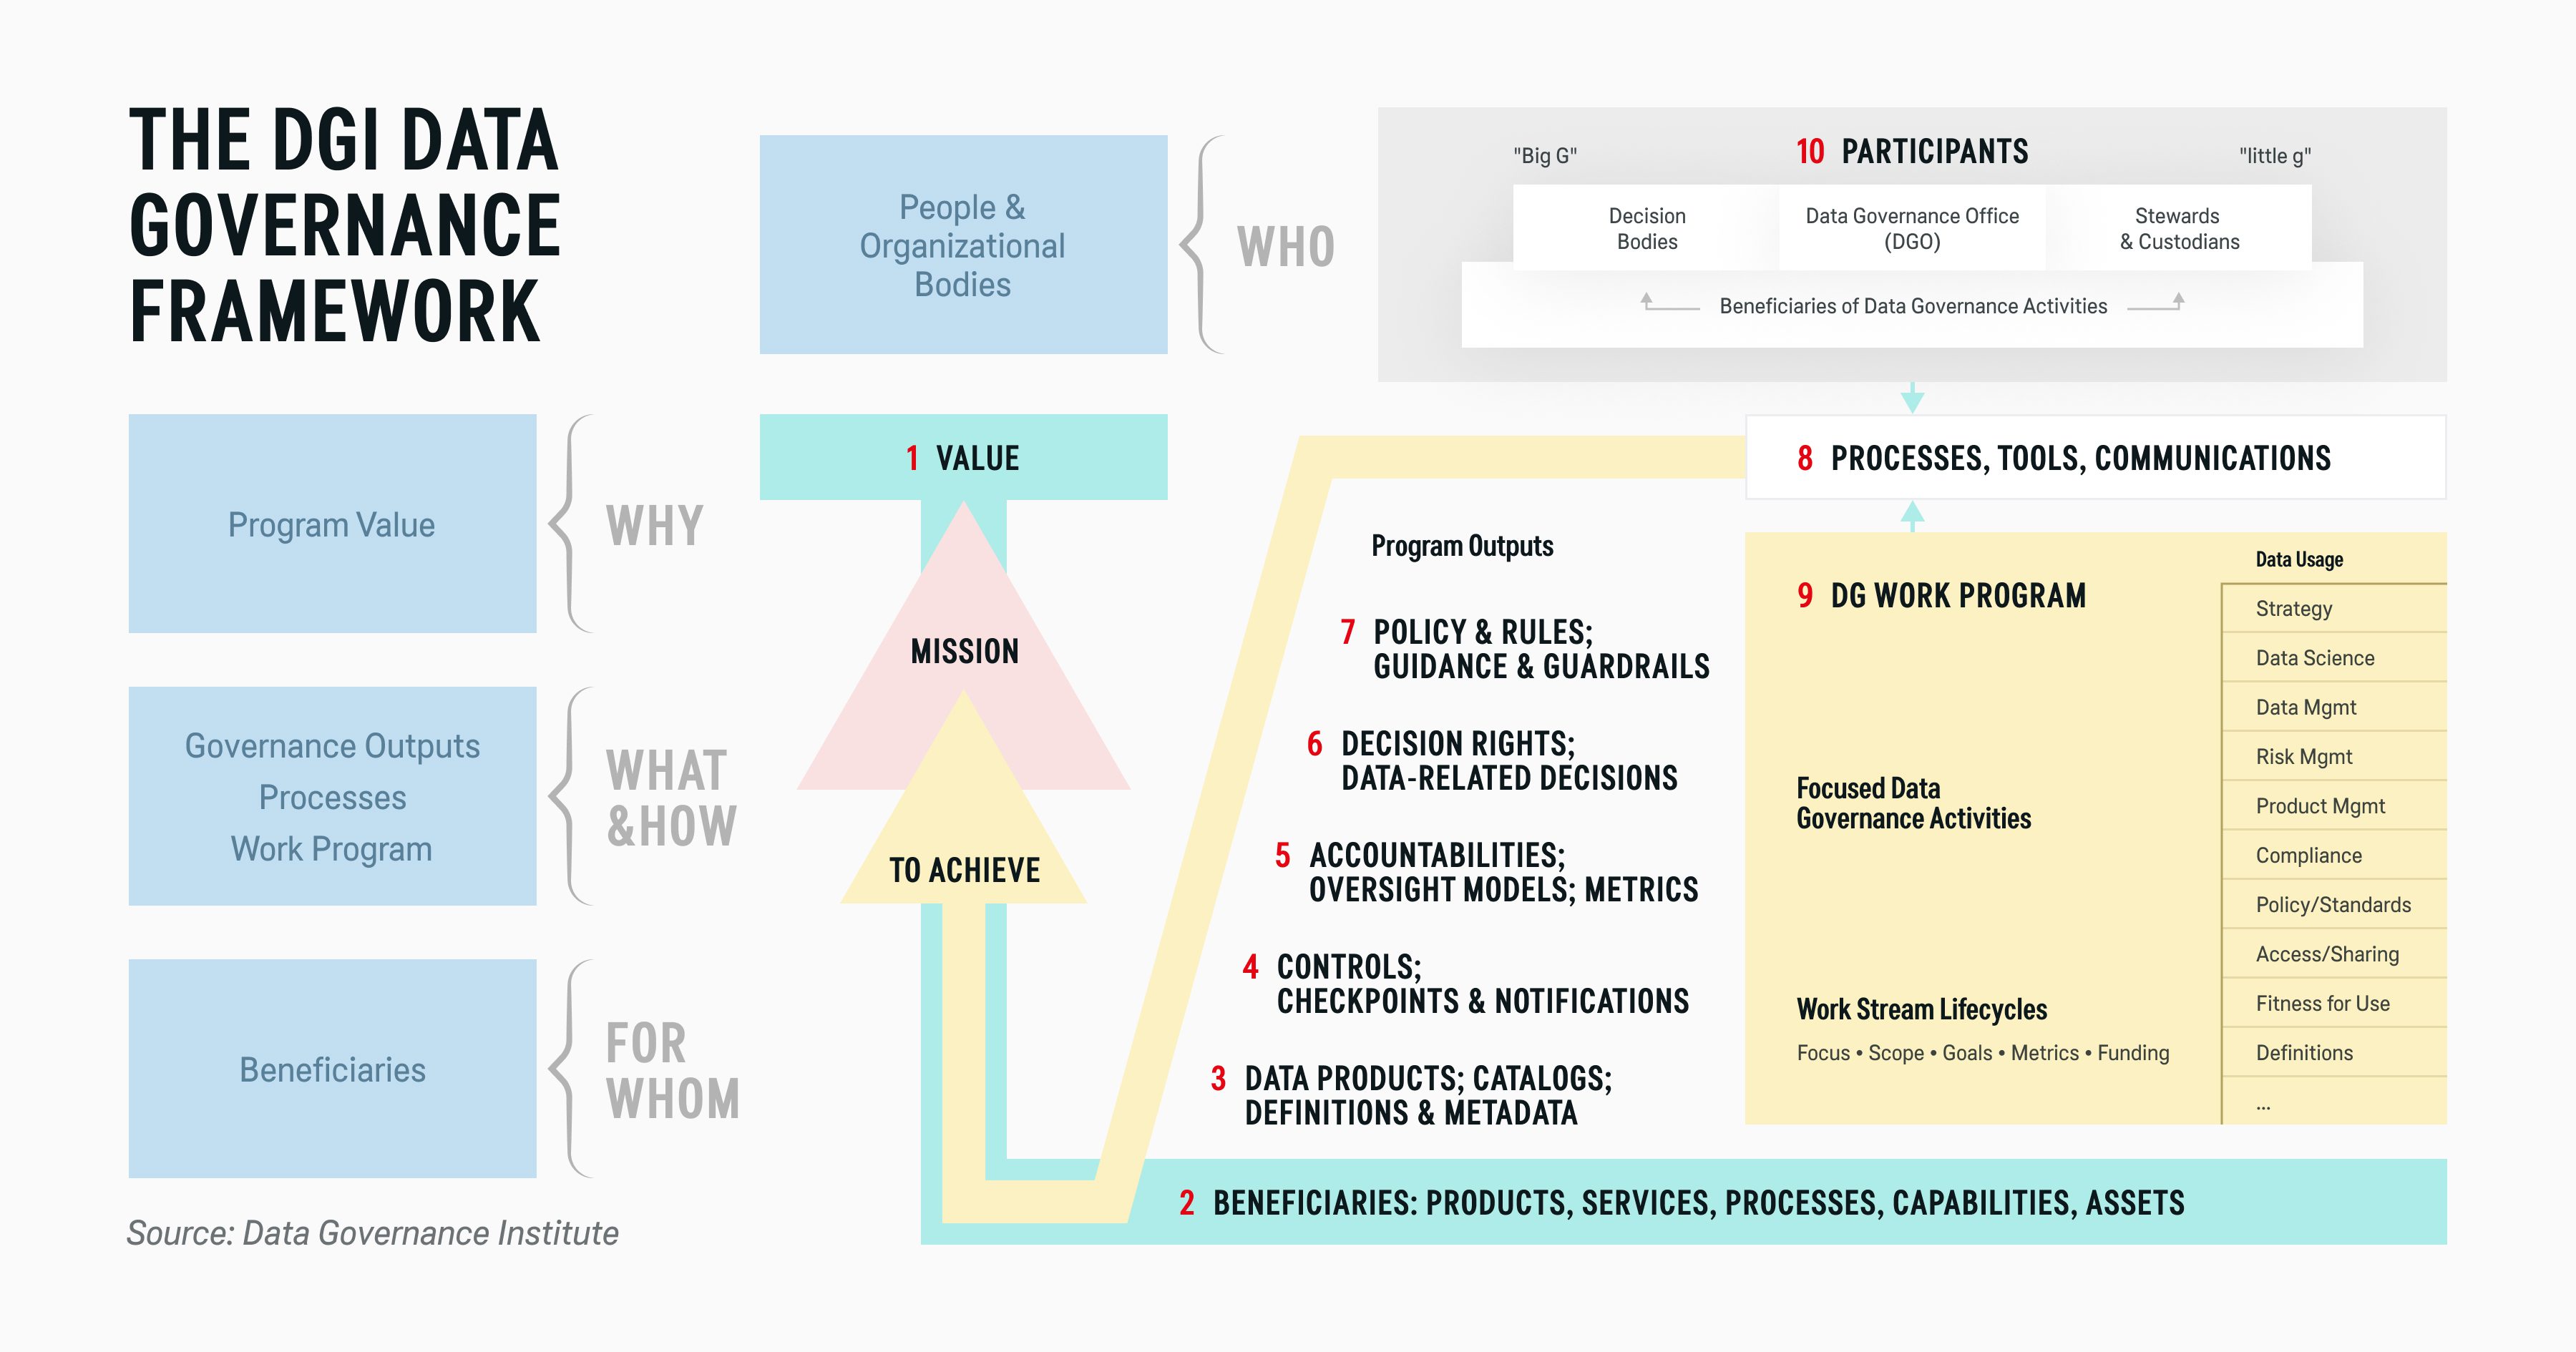
Data governance encompasses practices, policies, and standards to promote data availability, quality, and security. Some are codified at the infrastructure level, others as standard operating procedures or circulated as best practices.
Data governance forces everyone in the organization to be intentional about establishing data lineage, managing data uses, and safeguarding assets from accidental or malicious disclosures.
The Data Governance Institute defines the components of an effective data governance strategy:
DataOps aims to minimize the effort required for data management and maximize its value. It encourages the teams to continuously improve existing data flows and systems to promote data quality, consistency, and usage across the organizations.
New data product development is interactive and feedback-driven. Analytical pipelines include automatic anomaly and security issue detection and provide continuous feedback to the data engineering teams.
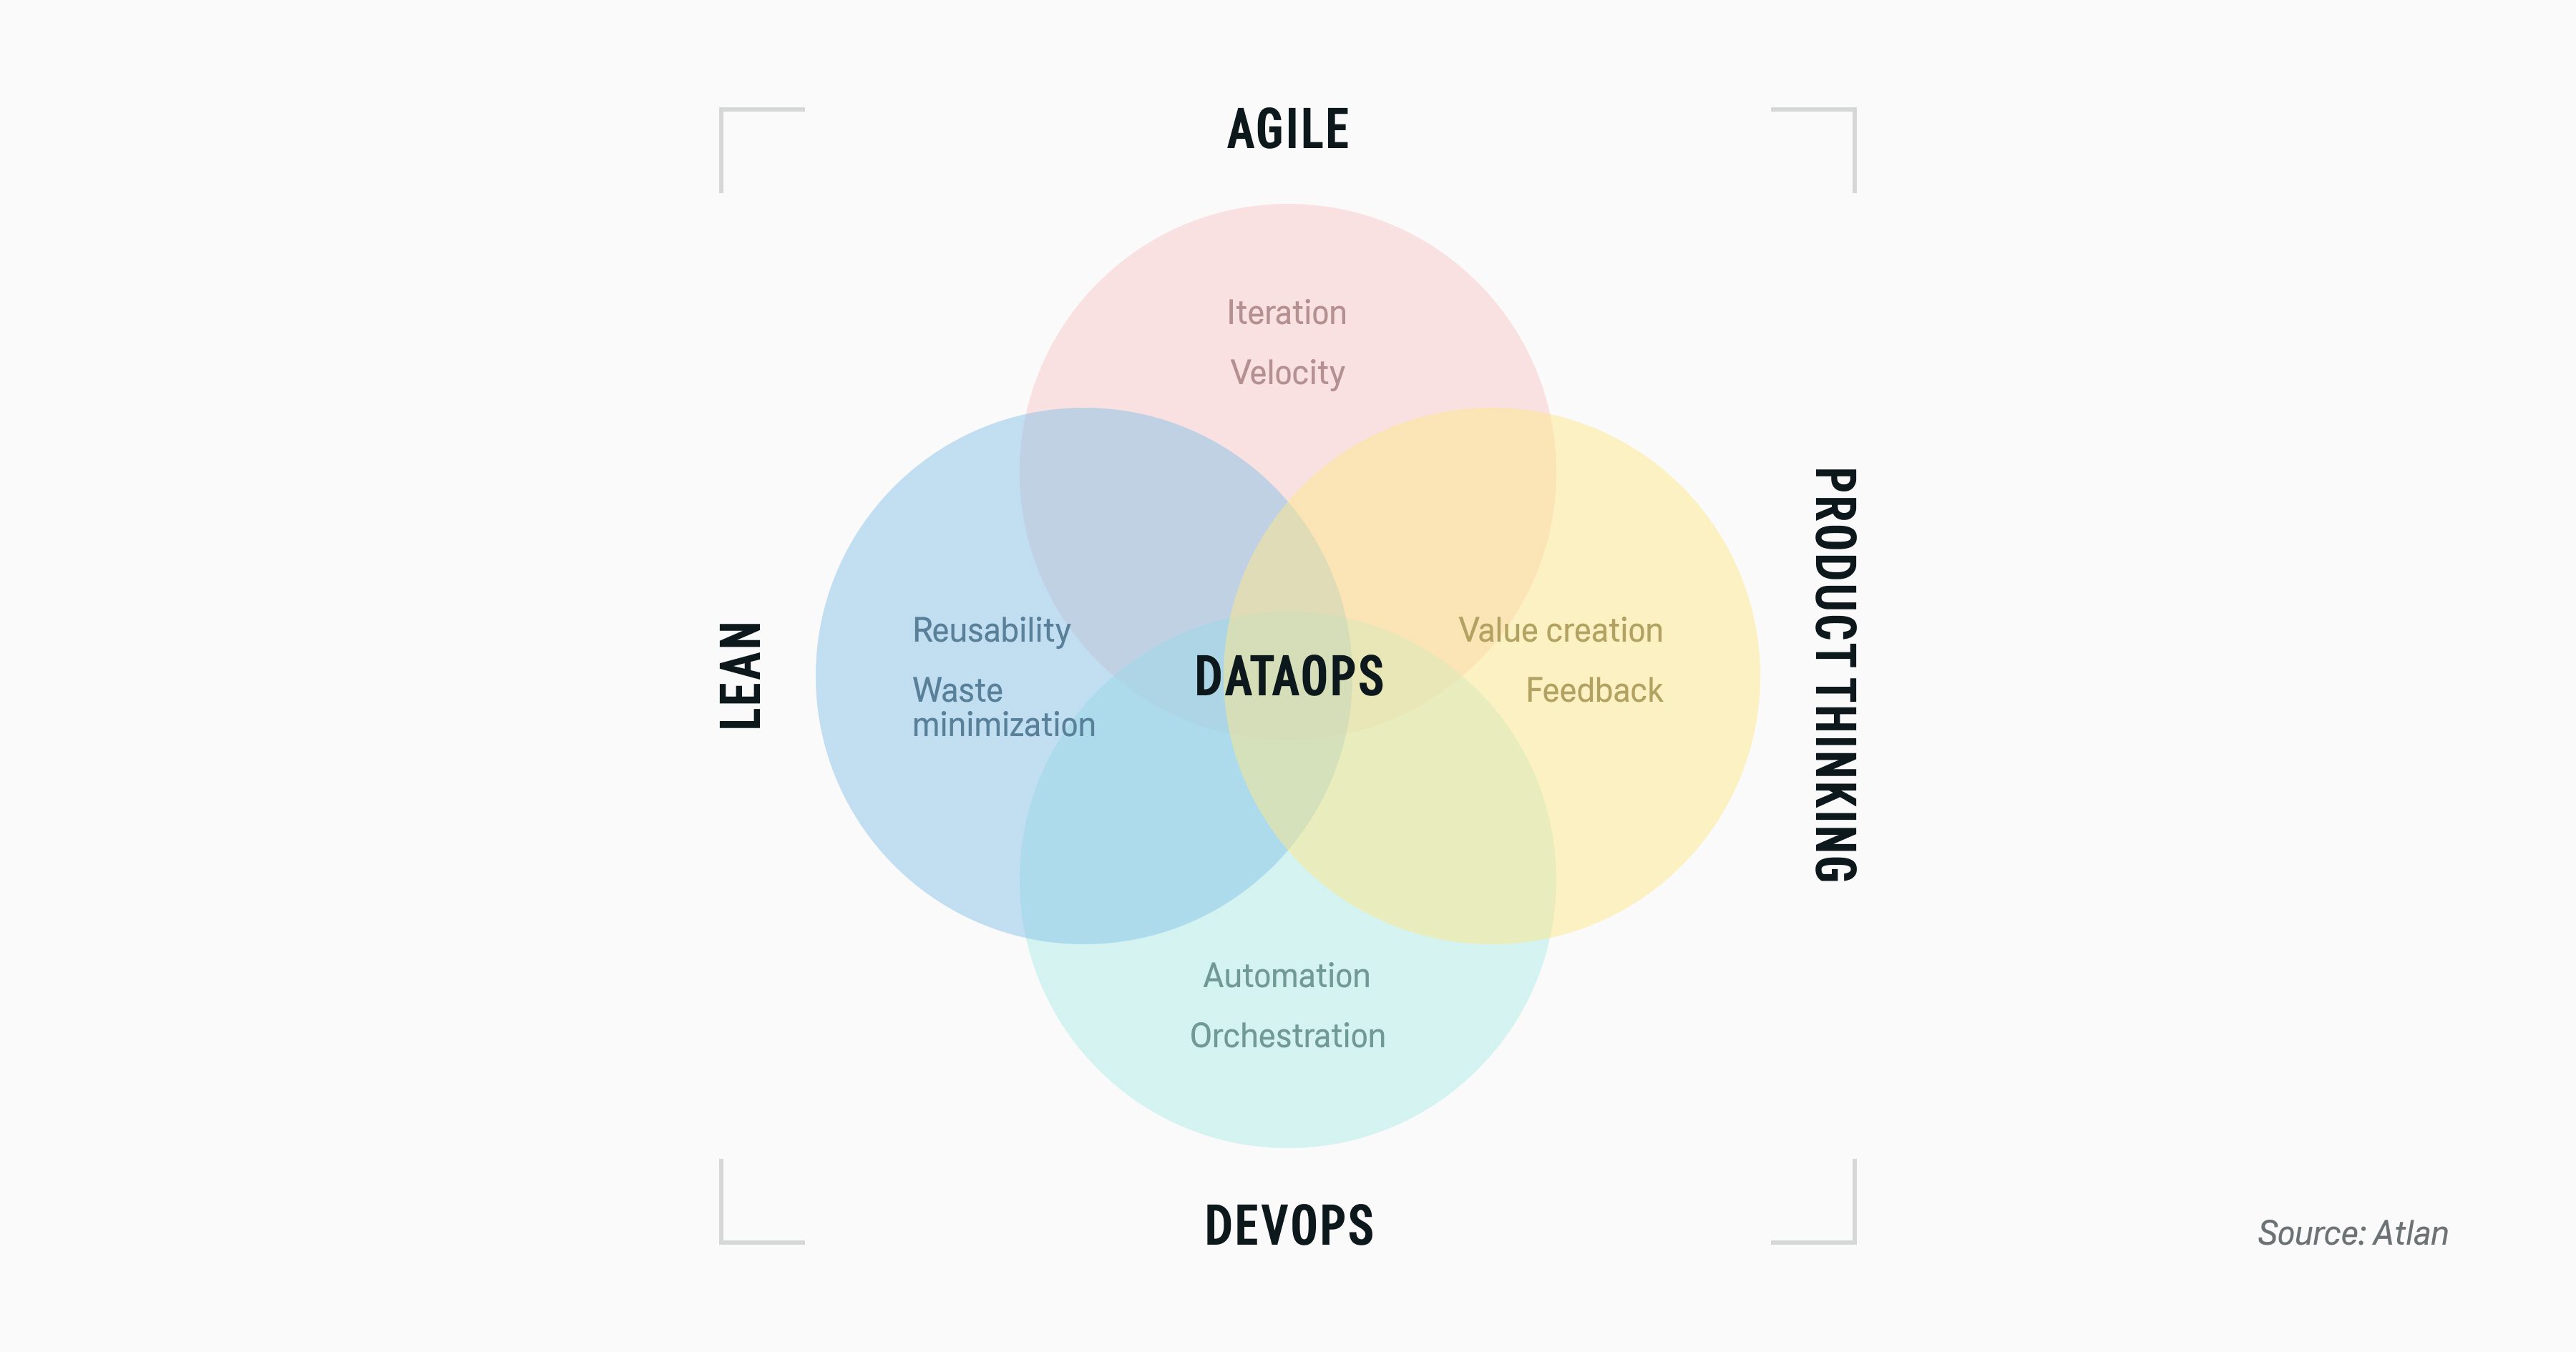
Source: Atlan
Effectively, DataOps ensures that all business requirements, concerning analytics quality, accuracy, security, and governance are embedded into the key workflows — and these processes are continuously refined to meet the changes.
Companies with a mature DataOps culture improve data accessibility (54%), achieve greater agility and responsiveness (42%), and benefit from faster deployments (36%), according to the State of DataOps report.
Any data initiatives will fall short when they’re built on shaky grounds. Data debt undermines trust in data and leads to poor operational decisions. Think Zillow’s $500 million mistake of purchasing homes for an overvalued price, based on false analytics suggestions.
Poor infrastructure and high error rates frustrate business users, increasing their reluctance to use analytics in the first place: 49% lack quick turnaround time, 42% user experience, and 40% easy navigation in BI tools used in their organization, according to the LogiAnalytics survey.
Doing a data audit is the first stepping stone towards building a data-driven culture. Better visibility into your data estate, proper processes for data validation, tracing data lineage, and transformation are critical for improving data reliability.

Need professional help to improve your data accessibility and responsiveness?
See what results our data integration consulting services can give
A modern data architecture, built with automated pipelines, scalable storage, and high concurrency querying, and the next element for scaling your operations. Data governance and DataOps, in turn, establish the necessary guardrails for ensuring your data remains reliable, secure, and easily accessible as your infrastructure scales to support more users and data products.

Sigma Software Group provides IT services to enterprises, software product houses, and startups. Working since 2002, we have build deep domain knowledge in AdTech, automotive, aviation, gaming industry, telecom, e-learning, FinTech, PropTech. We constantly work to enrich our expertise with machine learning, cybersecurity, AR/VR, IoT, and other technologies. Here we share insights into tech news, software engineering tips, business methods, and company life.
Linkedin profile

Many mid-size and large organizations depend on at least one legacy system no one wants to touch: often 10–20 years old, with outdated documentation and enginee...

Commercial vehicles are saturated with technology, yet many of them are ignored. Not because drivers don’t care, but because driving demands full attention. Thi...

Simple project. Obvious solution. Client needs a portal — possibly evolving into a marketplace — grab an existing CMS and get on with your life. We looked at th...