
CONTENTS
Physical Principles in Medical Imaging
Thank you for reaching out to Sigma Software!
Please fill the form below. Our team will contact you shortly.
Sigma Software has offices in multiple locations in Europe, Northern America, Asia, and Latin America.

USA

Sweden

Germany

Canada

Israel

Singapore

UAE

Australia

Austria

Ukraine

Poland

Argentina

Brazil

Bulgaria

Colombia

Czech Republic

Hungary

Mexico

Portugal

Romania

Uzbekistan
7 min read
Since IT creates solutions for many industries, software developers need to delve into specifics of various quite unexpected areas. One of the industries that gets increasingly digitalized today is healthcare. From EHRs to automated diagnostics, software solutions can bring endless improvements into healthcare workflows. A huge portion of such improvements relates to imaging, where software helps healthcare professionals get a better representation of human body, its parts, and processes as well as understand and interpret what is represented. I had a chance to find out a lot about medical imaging and would like to share my findings with you.
If not taking into account patient photos, images in medicine are the result of operation of different diagnostic tools (like X-ray, ultrasonography, MRI scanners, etc.). We are going to talk about diagnostic methods that can produce 3D (3-dimentional) result, particularly about MRI (magnetic resonance imaging) and CT (computed tomography). Precisely speaking, both of them are used not only in medicine, but also in any other industries, which require a non-destructive method of investigation of objects’ internals. Examples include internal defects of metal parts, composite materials internal structure (e.g. fiber orientation) investigation, archeological research (some mummies better stay sealed), etc.
Since the produced data is the same (internal object structure), the approach for processing is also the same. And only the methods of analysis and processing can be different (or not).
MRI and CT scanners, as it can be seen from their names, use different inspection techniques and thus produce different result.
According to a Wikipedia article: “Certain atomic nuclei are able to absorb and emit radio frequency energy when placed in an external magnetic field”. Therefore, MRI scanners analyze location of groups of specific atoms inside the object of investigation. For medical purposes, mostly hydrogen atoms are used, as a result we can see the density of water and fat inside human body. Thus, we can more or less clearly see organs and their irregularities, as well as blood vessels with blood flow inside them. The latter allows us to analyze blood flow issues (like sclerotic plaques or aneurysms).
However, MRI images can provide little help in dealing with bones.
In contrast, CT scanners use X-Rays to produce the resulting picture. From school physics lessons, we know that X-Rays better penetrate less dense matter, so we can see object density mapped to ray projecting surface. As such, they are already widely used to analyze bones structures and their damages. CT scanners is a further improvement of this technique, which allows achieving 3D X-Ray image. CT images are widely used in dentistry (for numerous cases), surgery (for planning complex surgeries), bone grafting, reconstructive surgery, etc.
Its disadvantage compared to MRI is the use of X-Rays, which leads to relatively high radiation doses. Besides, CT is almost useless in soft tissue analysis (there are techniques like using contrast materials, however).
Both CT and MRI scanners produce 3D data in a form of a set of 2D images (so-called slices). Each “slice” is an image of a specific slice of an object (human body for example). Combining them together, we can achieve a full picture (with some precision), see below:
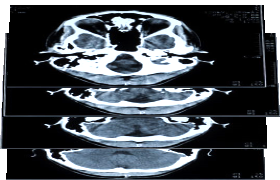
Example of slices forming 3D data
All modern scanners produce data as DICOM® (Digital Imaging and Communications in Medicine) images, as can be seen from its name it is international standard. Before that, every scanner used its own format and data processing/data exchange were quite complex.
The format itself is not designed to storing pixel data, it is more like a database, because we also need to store patient data, physical information, scanner-specific data, and other data there.
Now let’s dive into details. As we remember, 3D scanners produce a set of 2D images, which are monochromic (just one channel), usually having 12 or 16 bit depth (depending on the scanner). The value of each pixel depends on the material property and scanning principle. For CT scanners, for example, we have reference values for different materials, for MRI scanners things are more complex.
Since we are talking about medical and industrial application, we’d like to know not only material properties at a specific point, but also physical dimensions of the object. For this purpose, scanning parameters are saved into DICOM images. This includes pixel dimension (it can be different along different axis!), inter-slice distance, scanning orientation, origin point, and some others.
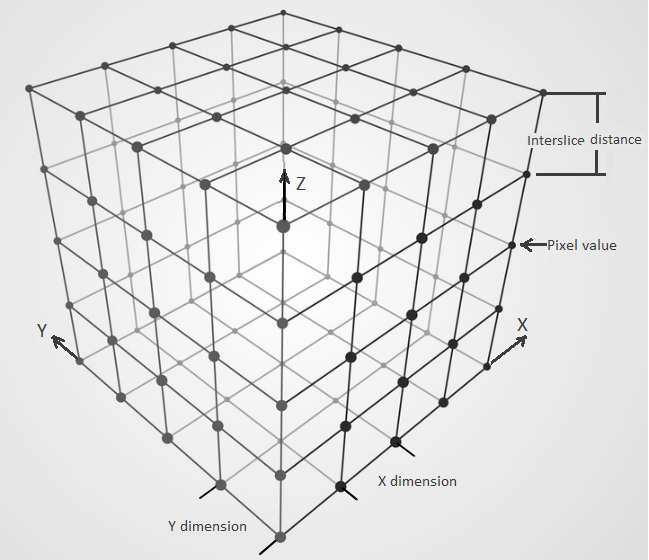
Scanned data representation
Based on this information, we can reconstruct original object orientation, its dimensions, and correctly map between voxels and their internals, thus being able to do many useful things like real measurements and material properties reconstruction (for example, using the finite element analysis).

Where (Xx, Xy, Xz), (Yx, Yy, Yz) and (Zx, Zy, Zz) are directions of X, Y and Z axis respectively. Ox, Oy, Oz – image origin. Sx, Sy, Sz – correspondent scale.
With Sz it’s not that simple – actually we do not have a specific inter-slice distance, instead we have distances between slice pairs, which aren’t equal usually. To workaround this, we can either “reslice” the entire image set to have common inter-slice distance (and thus have a simple value for Sz), or we can have a “virtual” scale, which then will be mapped to the actual slice position.
However, there is more about physical data reconstruction. Some scanners produce skewed images (which is called ‘gantry tilt’), and this fact should be considered during image processing.
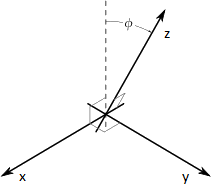
Gantry tilt explanation
To correctly process this, we should either add ‘no data’ on the image boundaries to remove skewness, or take this angle into account during the coordinate system reconstruction:

Some scanners can even produce a 3D video! This is done by taking images again and again, so it’s not a real 3D video, but rather sliding in time images (one image at a time). As each image has its own timestamp, the original sequence can be reconstructed. Since scanners are not very fast, usually only some small part is recorded in such manner.
This technique is used for example for capturing a beating heart.
Let’s talk about some practical applications, which are either impossible or very costly when doing them manually (i.e. without automation support).
Segmentation is a process of selection of the part of interest on images. And if bones segmentation is more or less feasible, vessels segmentation will take much effort. This process helps to:
There are different algorithms, used to perform this task, among them:
There are modifications, which require manual aid. In any case, they greatly reduce time for such operations, and in some cases make the things that used to be impossible completely feasible.

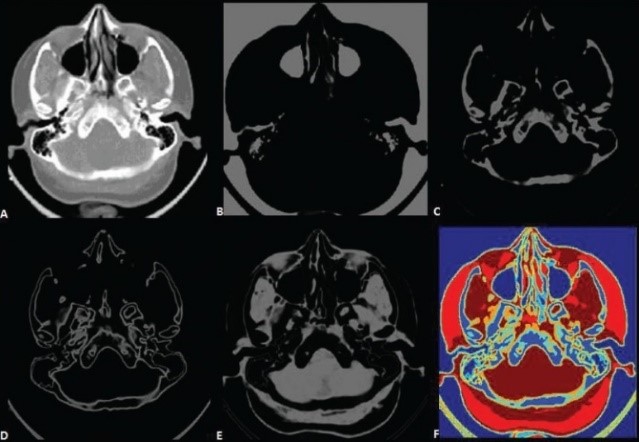
Result of operation of segmentation algorithms
Photo source: Automated medical image segmentation techniques
Another example of a widely used algorithm is marching cubes. It is used for reconstructing a 3D object form its scanned representation . As input it uses the result of the previous algorithm.
Original algorithm has been developed in 1987. Now multiple modifications exist and continue to be developed!
Final Element Analyses is a technology widely used for modeling object properties and their behavior under different conditions. This includes both static analyses and dynamics loads. You can construct FEA model from a 3D image (or its part) and perform the analysis. In particular, in medicine, this can be used during implants creation or modeling blood flow after vessel stenting.
The real value of accurate visual recognition in healthcare is difficult to overestimate. In case of a false positive diagnosis, it leads to extra tests, unrequired procedures, and days of worried waiting of a patient. What is a probability of a false positive, you may ask. Well, independent studies found that “50% to 63% of U.S. women can expect to receive false-positive mammography results one or more times”.
Visual pattern recognition software can improve accuracy of diagnostics by 5% to 10% in comparison to solely human recognition, and this number will grow in the years to come. Hopefully, the increasing expansion of artificial intelligence-based pattern recognition solutions and their constant advancing will help eliminate a considerable part of false diagnoses in many medical fields. On own IT side, we will work to make it happen.

Anton has been working as a developer in different industries: from medicine to digital maps. He has a wide range of interests in IT, including architecture, device drivers development, and more.

For decades, the manufacturing formula for success was the same – build great equipment, ship to the Client, and get the profit. Now, more OEMs are discovering ...

Connected products have spent years generating enormous volumes of data — sensor readings, telemetry, historical logs. Yet much of this information was rarely u...

If you own a product line, run an embedded or connectivity team, or look after the cloud and data stack for connected devices, the EU Data Act probably didn’t a...